, um zu prüfen, ob Sie einen Vollzugriff auf diese Publikation haben.
Monographie Kein Zugriff
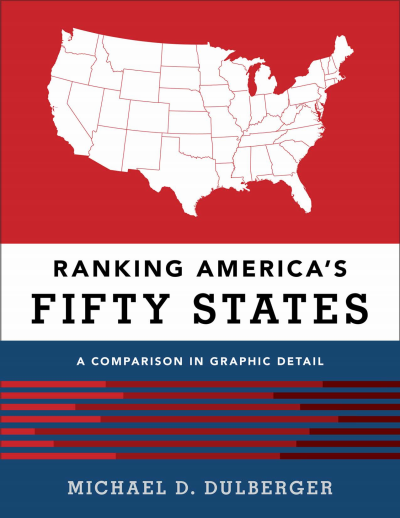
Ranking America's Fifty States: a Comparison in Graphic Detail
- Autor:innen:
- Verlag:
- 2013
Publikation durchsuchen
Bibliographische Angaben
- Auflage
- 1/2013
- Copyrightjahr
- 2013
- ISBN-Print
- 978-1-59888-669-6
- ISBN-Online
- 978-1-59888-670-2
- Verlag
- Bernan, Lanham
- Sprache
- Englisch
- Seiten
- 222
- Produkttyp
- Monographie
Inhaltsverzeichnis
KapitelSeiten
- Contents Kein Zugriff
- Introduction Kein Zugriff
- Demographics Overview Kein Zugriff
- Demographics Summary Table Kein Zugriff
- Population (313.9 million persons nationally in 2012) Kein Zugriff
- Population Growth (9.7 percent nationally, 2000–2010) Kein Zugriff
- Net Immigration (8.9 million persons nationally, 2000–2009) Kein Zugriff
- Persons Born in a Different State than Their State of Residency (27.0 percent nationally in 2009) Kein Zugriff
- Foreign-Born Residents (13.9 percent nationally in 2009) Kein Zugriff
- Birth Rate (66.7 births per 1,000 women nationally in 2009) Kein Zugriff
- Births to Foreign-Born Women (20.3 percent nationally in 2009) Kein Zugriff
- Births by Race and Hispanic Origin (4.1 million nationally in 2009) Kein Zugriff
- Residents by Race—Other than White (27.6 percent nationally in 2010) Kein Zugriff
- Residents of Hispanic or Latino Origin (16.3 percent nationally in 2010) Kein Zugriff
- Minority Students Grades K–12 (47.5 percent nationally in 2011) Kein Zugriff
- Foreign Language Spoken at Home (20.0 percent of households nationally in 2009) Kein Zugriff
- Median Age (37.2 years old nationally in 2010) Kein Zugriff
- Population Over Age 64 (13.0 percent nationally in 2010) Kein Zugriff
- Old Age Dependency Ratio (persons over age 64 per 100 persons ages 18–64) Kein Zugriff
- Population Density (88.1 persons per square mile nationally in 2011) Kein Zugriff
- Population Living in Urban Areas (79.0 percent nationally in 2000) Kein Zugriff
- Health Overview Kein Zugriff
- Health Summary Table Kein Zugriff
- Life Expectancy at Birth in 2000 (males 76.0 years; females 80.9 years nationally in 2009) Kein Zugriff
- Infant Mortality Rate (6.4 deaths per 1,000 live births nationally in 2009) Kein Zugriff
- Pre-Term Births (12.0 percent nationally in 2010) Kein Zugriff
- Low Birth Weight Babies (8.2 percent nationally in 2009) Kein Zugriff
- Adult Obesity Rate (percent in 2011) Kein Zugriff
- Age-Adjusted Cancer Death Rate (173.2 deaths per 100,000 persons nationally in 2009) Kein Zugriff
- Cigarette Smoking by Adults (20.6 percent nationally in 2009) Kein Zugriff
- Suicide Rate (11.3 per 100,000 residents nationally in 2007) Kein Zugriff
- Illicit Drug Use—Other than Marijuana (3.6 percent nationally in 2007–2008) Kein Zugriff
- Marijuana Use (6.0 percent nationally in 2007–2008) Kein Zugriff
- Binge Alcohol Drinkers (23.3 percent nationally in 2007–2008) Kein Zugriff
- Alcohol-Impaired Traffic Fatalities (31 percent of traffic fatalities nationally in 2010) Kein Zugriff
- Traffic Fatality Rate (1.1 deaths per 10,000 persons nationally in 2010) Kein Zugriff
- Persons Without Health Insurance (16.7 percent nationally in 2009) Kein Zugriff
- Physicians per 100,000 Residents (273 nationally in 2009) Kein Zugriff
- Lifestyle Overview Kein Zugriff
- Lifestyle Summary Table Kein Zugriff
- Births to Unmarried Women (41.0 percent nationally in 2009) Kein Zugriff
- Births to Teenage Mothers (10.0 percent nationally in 2009) Kein Zugriff
- Births to Women Below Poverty Level (26.6 percent nationally in 2009) Kein Zugriff
- Abortion Rate (19.6 per 1,000 women nationally in 2008, [national total 1.21 million]) Kein Zugriff
- Marriage Rate (6.8 per 1,000 residents nationally in 2009) Kein Zugriff
- Divorce Rate (3.4 per 1,000 residents nationally in 2009) Kein Zugriff
- Same-Sex Couple Households (902,000 nationally in 2010) Kein Zugriff
- Christian Church Adherents (47.4 percent of population nationally in 2010) Kein Zugriff
- Jewish Population (2.1 percent of population nationally in 2010) Kein Zugriff
- Charitable Contributions per Capita ($523 nationally in 2008 ($170.4 billion total]) Kein Zugriff
- Volunteer Rate (26.3 percent of persons nationally in 2010) Kein Zugriff
- Eligible Voters who Voted for President (58.9 percent voted in 2012) Kein Zugriff
- Voters Selecting Obama over Romney for President in 2012 (Obama won by 3.5 percent margin) Kein Zugriff
- Voters Selecting Obama over McCain for President in 2008 (Obama won by 7.3 percent margin) Kein Zugriff
- Residents who Voted for Congress (37.0 percent of voting age persons nationally in 2010) Kein Zugriff
- U.S. Congressional Seats Held by Political Party (435 House seats in 2013 for 113th Congress) Kein Zugriff
- Households Without Internet Usage (19.8 percent nationally in 2010) Kein Zugriff
- Daily Newspaper Circulation (15.1 per 100 persons nationally in 2009) Kein Zugriff
- Library Visits per Capita (5.1 nationally in 2008) Kein Zugriff
- Patents Issued to Residents (39.2 per 100,000 residents nationally in 2010 [121,164 total]) Kein Zugriff
- Foreign Visitors (26.4 million nationally in 2010) Kein Zugriff
- State Park Recreation Visitors (741 million nationally in 2010) Kein Zugriff
- National Park Recreation Visitors (279 million nationally in 2010) Kein Zugriff
- Firearms Background Checks Rate (309 checks per 1,000 persons nationally in 2010) Kein Zugriff
- Education Overview Kein Zugriff
- Education Summary Table Kein Zugriff
- Pupil-to-Teacher Ratio (16.0 nationally in 2011) Kein Zugriff
- Expenditures per Capita for Public K-12 Education ($1,944 nationally in 2009 [$505.7 billion total]) Kein Zugriff
- Grade 4 Reading Proficiency Levels (average score 33 nationally in 2009) Kein Zugriff
- Grade 4 Math Proficiency Levels (average score 39 nationally in 2009) Kein Zugriff
- Grade 4 Science Proficiency Levels (average score 27 nationally in 2009) Kein Zugriff
- Grade 8 Reading Proficiency Levels (average score 32 nationally in 2009) Kein Zugriff
- Grade 8 Math Proficiency Levels (average score 34 nationally in 2009) Kein Zugriff
- Grade 8 Science Proficiency Levels (average score 29 nationally in 2009) Kein Zugriff
- High School Graduation Rate (85.3 percent nationally in 2009) Kein Zugriff
- Tertiary Education Attainment (27.9 percent nationally in 2009) Kein Zugriff
- Higher Education Degrees Conferred (2,138 thousand nationally in 2007) Kein Zugriff
- College Freshmen Enrolled in Their Home State (74.3 percent nationally in 2008) Kein Zugriff
- College Freshmen Migrated from Other States (391,000 nationally in 2008) Kein Zugriff
- College Freshmen Interstate Migration Ratio (391,000 migrated nationally in 2008) Kein Zugriff
- Net Interstate Migration of College Freshmen (thousands of persons in 2009) Kein Zugriff
- Crime Overview Kein Zugriff
- Crime Summary Table Kein Zugriff
- Violent Crime Rate (406 per 100,000 persons nationally in 2010) Kein Zugriff
- Murder Rate (5.1 per 100,000 persons nationally in 2009) Kein Zugriff
- Child Abuse and Neglect Victims (1,010 per 100,000 children nationally in 2009) Kein Zugriff
- Property Crime Rate (3,072 per 100,000 persons nationally in 2009) Kein Zugriff
- Motor Vehicle Theft Rate (240 motor vehicles per 100,000 persons nationally in 2010) Kein Zugriff
- Identity Theft Victims (81 per 100,000 persons nationally in 2010) Kein Zugriff
- Prisoners (523 per 100,000 persons nationally in 2009) Kein Zugriff
- Prisoner Executions (1,234 nationally 1977–2010) Kein Zugriff
- Criminal Justice Expenditures ($677 per capita nationally in 2007) Kein Zugriff
- Incoming State Criminal Court Cases (6,887 per 100,000 persons nationally in 2009) Kein Zugriff
- Incoming State Trial Court Cases (34,362 per 100,000 persons nationally in 2008) Kein Zugriff
- Environment Overview Kein Zugriff
- Environment Summary Table Kein Zugriff
- Major Disaster/Fire Management Assistance Declarations (2,588 nationally, 1953–2012) Kein Zugriff
- Earthquake and Flood Major Disaster Declarations (1,266 nationally, 1953–2012) Kein Zugriff
- Storm Major Disaster Declarations (637 nationally, 1953–2012) Kein Zugriff
- Wildfire Management Assistance Declarations (630 nationally, 1953–2012) Kein Zugriff
- Lowest Air Temperature on Record (degrees Fahrenheit, 1885–2010) Kein Zugriff
- Highest Air Temperature on Record (degrees Fahrenheit, 1885–2010) Kein Zugriff
- Winter Air Temperature (degrees Fahrenheit, 1971–2000) Kein Zugriff
- Summer Air Temperature (degrees Fahrenheit, 1971–2000) Kein Zugriff
- Air Temperature Range (degrees Fahrenheit, 1971–2000) Kein Zugriff
- Total Degree Days (annual average for selected cities, 1986–2009) Kein Zugriff
- Heating Degree Days (annual, average for selected cities, 1986–2009) Kein Zugriff
- Cooling Degree Days (annual, average for selected cities, 1986–2009) Kein Zugriff
- Relative Humidity (annual, average afternoon for selected cities, 1986–2009) Kein Zugriff
- Cloudy Days (average, annual percentage for selected cities, 1986–2009) Kein Zugriff
- Annual Precipitation (average, annual inches,1971–2000) Kein Zugriff
- Snow, Hail, Ice Pellets, and Sleet (average, annual for selected cities, 1960–2008) Kein Zugriff
- Air Quality "Good" Days for the Average County in the State (percent of days rated "good" in 2012) Kein Zugriff
- Air Quality "Good" Days for the Best County in the State (percent of days rated "good" in 2012) Kein Zugriff
- Carbon Dioxide Emissions (percent of nation's total in 2010) Kein Zugriff
- Toxic Chemical Releases (3,386 million pounds nationally in 2009) Kein Zugriff
- Resources Overview Kein Zugriff
- Resources Summary Table Kein Zugriff
- Land Area (2.53 million square miles nationally) Kein Zugriff
- Forest Lands (percent of 246 million acres nationally in 2010) Kein Zugriff
- Farm Land (percent of nation's 920 million acres in 2010) Kein Zugriff
- Exports of Agricultural Products (percent of national total in 2009 [$96.6 billion]) Kein Zugriff
- Farm Crops Market (percent of nation's $163.7 billion in 2009) Kein Zugriff
- Farm Livestock Market (percent of nation's $119.8 billion in 2009) Kein Zugriff
- Energy Consumption per Capita (327 million BTUs per capita nationally in 2008) Kein Zugriff
- Crude Oil Proved Reserves (percent of 20.7 billion barrels nationally in 2009) Kein Zugriff
- Crude Petroleum Production (percent of 2.0 billion barrels nationally in 2010) Kein Zugriff
- Natural Gas Proved Reserves (percent of 272.5 trillion cubic feet nationally in 2009) Kein Zugriff
- Natural Gas Marketed Production (percent of 21.6 trillion cubic feet nationally in 2009) Kein Zugriff
- Demonstrated Coal Reserves (percent of 486.1 billion short tons nationally in 2009) Kein Zugriff
- Nuclear Power Generation of Electricity (percent of state's electricity generation in 2009) Kein Zugriff
- Renewable Energy Production (percent of national total in 2010) Kein Zugriff
- Mineral Production ($ billions in 2010 [$64.0 billion nationally]) Kein Zugriff
- Personal Finances Overview Kein Zugriff
- Personal Finances Summary Table Kein Zugriff
- Personal Income per Capita ($39.9 thousand nationally in 2010) Kein Zugriff
- Median Household Income ($50.2 thousand nationally in 2009) Kein Zugriff
- Households with Annual Income Below $15,000 (13.5 percent nationally in 2009) Kein Zugriff
- Households with Annual Income Over $200,000 (3.9 percent nationally in 2009) Kein Zugriff
- Individuals Below Poverty Level (14.3 percent nationally in 2009) Kein Zugriff
- Individuals with Net Worth Over $2.0 million (6.0 per 1,000 persons nationally in 2007) Kein Zugriff
- Home Ownership Rate (66.9 percent of households nationally in 2010) Kein Zugriff
- Owner Occupied Housing Values (median home value $185.2 thousand nationally in 2009) Kein Zugriff
- Single-Family Housing Price Index (national average 185.7 in 2010) Kein Zugriff
- Rental Housing Cost ($842 median rental cost per month nationally in 2009) Kein Zugriff
- Labor Union Membership (11.9 percent of workers nationally in 2010) Kein Zugriff
- Employee Annual Wages ($45.6 thousand nationally in 2009) Kein Zugriff
- Manufacturing Employee Annual Payroll ($48.3 thousand nationally in 2009) Kein Zugriff
- Employees in Manufacturing (8.9 percent of all employees nationally in 2010) Kein Zugriff
- Value Added per Manufacturing Production Worker ($261 thousand nationally in 2009) Kein Zugriff
- Bankruptcy Filings (5.1 per 1,000 persons nationally in 2010 [1.6 million total]) Kein Zugriff
- Employment in Foreign-Controlled Businesses (4.7 percent of workforce nationally in 2008) Kein Zugriff
- State Economy Overview Kein Zugriff
- State Economy Summary Table Kein Zugriff
- State Personal Income Tax per Capita ($832 nationally in 2011) Kein Zugriff
- State General Sales Tax per Capita ($753 nationally in 2011) Kein Zugriff
- State Taxes per Capita by Source ($1,713 nationally in 2011) Kein Zugriff
- Local Government Taxes per Capita by Source ($1,686 nationally in 2008) Kein Zugriff
- State Gasoline Tax (21.8 cents per gallon nationally in 2009) Kein Zugriff
- State Debt per Capita ($3,259 nationally in 2008 [$1.0 trillion total]) Kein Zugriff
- State Severance Tax on Businesses per Capita ($59 nationally in 2008, $18.3 billion total) Kein Zugriff
- Lottery Revenue ($52.8 billion nationally in 2008) Kein Zugriff
- Unemployment Rate (8.5 percent nationally, October 2011–March 2012) Kein Zugriff
- State Employees per Resident (14.3 per one thousand residents nationally in 2009) Kein Zugriff
- Cost of Living Composite Index for Highest City in 2010 Kein Zugriff
- Cost of Living Composite Index for Lowest City in 2010 Kein Zugriff
- Cost of Living Composite Index Range in 2010 Kein Zugriff
- Gross Domestic Product ($14,981 billion national total in 2011) Kein Zugriff
- Gross Domestic Product per Capita ($48,079 nationally in 2011) Kein Zugriff
- Manufacturing Portion of Gross Domestic Product (12.3 percent nationally in 2011) Kein Zugriff
- Exports of Goods (percent of national total in 2010 [$1.29 trillion]) Kein Zugriff
- Research and Development ($23.1 per $1,000 of GDP nationally in 2007) Kein Zugriff
- State Arts Agency Appropriations ($.88 per capita nationally in 2011 [$272 million total]) Kein Zugriff
- Federal Influence Overview Kein Zugriff
- Federal Influence Summary Table Kein Zugriff
- Federal Personal Income Taxes Paid per Capita ($2,894 nationally in 2010) Kein Zugriff
- Federal Personal Income Tax Rate Paid (7.2 percent nationally in 2010) Kein Zugriff
- Federal Tax Revenues per Capita ($7,596 nationally in 2009 [$2.35 total trillion]) Kein Zugriff
- Federal Expenditure Distribution (total = $3,518 billion in 2009, $3,653 billion in 2013) Kein Zugriff
- Federal Disbursements per Capita ($10.4 thousand nationally in 2009 [$3.24 trillion total]) Kein Zugriff
- Federal Disbursements in Excess of Taxes Collected ($893.2 billion nationally in 2009) Kein Zugriff
- Federal Disbursements in Excess of Taxes per Capita ($2.8 thousand nationally in 2009) Kein Zugriff
- Federal Aid to State and Local Government per Capita ($1,788 nationally in 2009 [$522 billion total]) Kein Zugriff
- Food Stamp Recipients (13.0 percent of persons nationally [$64.7 billion total]) Kein Zugriff
- Medicaid Payments ($317.99 billion nationally in 2009) Kein Zugriff
- Medicaid Recipients (20.0 percent of population nationally in 2009) Kein Zugriff
- Supplemental Security Income per Capita ($151 nationally in 2009 [$46.6 billion total]) Kein Zugriff
- Federal Financing of Public K-12 Education (10.1 percent nationally in 2009 [$57.3 billion total]) Kein Zugriff
- Federal Highway Subsidies per Capita ($115 nationally in 2009 [$34.6 billion total]) Kein Zugriff
- Federal Subsidies for Agriculture (percent of nation's $12.3 billion in 2009) Kein Zugriff
- Homeland Security Grants per Capita ($5.6 nationally in 2010 [$1.73 billion total]) Kein Zugriff
- Defense Department Payroll per Capita ($633 nationally in 2009 [$195.2 billion total]) Kein Zugriff
- Defense Department Personnel (2.62 million nationally in 2009) Kein Zugriff
- Defense Department Contract Awards ($984 per capita nationally in 2009 [$303 billion total]) Kein Zugriff
- Government Employment (14.2 percent nationally in 2011) Kein Zugriff
- Map of the United States Kein Zugriff
- The Top and Bottom Ranked States Kein Zugriff
- Resources Kein Zugriff
- Index Kein Zugriff Seiten 208 - 222